
Use Case:
Process raw claims data (medical insurance or vehicle contracts related data) which is a large dataset and generate reporting visuals with the help of processed data.
The problem here is to handle such a large dataset and generate complex reporting by doing data transformation.
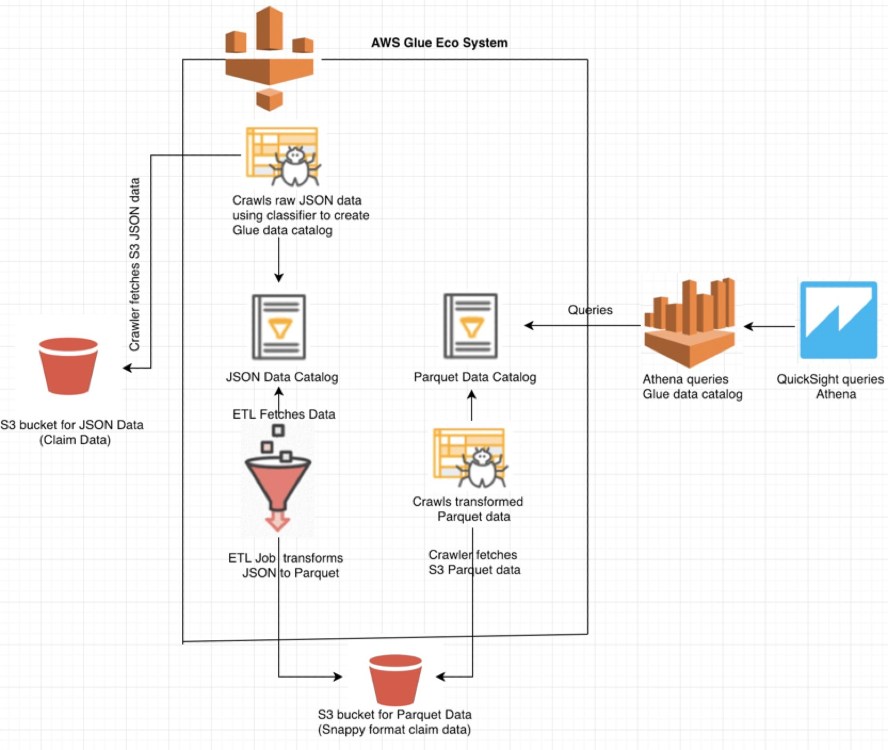
In order to fulfill this end to end requirement usage of AWS services is the best option. We can use Amazon S3 for data storage, data transformation (ETL) using Glue and then data visualization (Analytics) via Athena & QuickSight.
Below diagram represents the workflow of usage of these AWS services.

First we need to generate our data set. In this use case, we can use the claims data of medical insurance company or vehicle contracts. This data is in JSON format which needs to be stored in S3 bucket as mentioned in the above diagram.
Now we have the JSON data, we need to structure it enough that Athena can query it. This is where Glue comes into the picture. First it provides data crawlers that use inbuilt and/or custom classifiers to try and parse the JSON data. The crawler will traverse the specified S3 files and group the things into tables. Athena uses these tables for querying.
For proper grouping of Glue metadata tables, create customized classifiers based on different data types such as ‘JSON’.
Since in our use case we are using JSON data set, we can use JSON custom classifier (regex) where we can mention a JSON path expression which can be used to define a JSON structure and table schema.
Next create a crawler using the classifier, and select input as the JSON data from stored S3 bucket path. This will parse all the files from S3 bucket. After running the crawler, a table gets created which stores all the metadata about the JSON file for querying purpose.
At this point we could actually query the data, but best practice is to run an ETL (Extract, Transform & Load), to transform the data so it is more efficient to query later on.
The data format chosen is Parquet. Parquet has been selected as it is columnar. For large data sets it reduces scanned data and reduces query time hence reducing the cost required for scanning the data in Athena. Athena pricing varies based upon the scanning of the data. $5 per TB of data scanned is the pricing for Athena.
We transform our data set, by using a Glue ETL. Select the input as a previously crawled JSON data table and select a new output empty directory. Edit the schema and be sure to fix any values, like adding the correct data types. This creates a python ETL script which we can edit or clean data if any.
For transforming large data, we can also use partitioning which divides the table into parts and keeps the related data together based on column values. It can also help to reduce the amount of data scanned per query, thereby improving performance.
Once we run this Glue job, the parquet format snappy files are available under the new S3 bucket output directory. Then similar to JSON data, run crawler for getting the schema and data catalog for executing queries using Athena.
For dynamic visualizations, we need to use QuickSight tool which can access data from multiple sources such as different files (.csv, .tsv, .clf, .elf, .xlsx, .json) using File upload, AWS data sources such as Athena, Redshift, RDS, S3 etc. and the external data sources such as SQL Server, SalesForce, Twitter, JIRA etc.
In our use case we need to select a datasource as ‘Athena’ and select the database along with the table name to connect to QuickSight.
Using QuickSight we can easily analyze the transformed data. The dashboard can be generated using many visual types such as bar charts, line charts, pie chart, pivot table etc. These visuals have different formatting options along with filtering which we can use to customize the visuals as per our need. We can also use calculated fields using different formulas given. Parameters can also be used for customization of the reports.
We can generate different visuals for Claim data such as ‘Average number of Days required to submit a claim from user’ , ”Average number of Days required to approve a claim by medical insurance company”, “Number of vehicle claims by age group” etc. based on the claims data we have.
Observations:
If you want to use simple JSON format as a datasource in S3 bucket without using Glue classifiers and want to work with Athena, below are some points you can consider for the JSON files.
- Each item from the JSON should be on one line.
- No semicolons between the two items.
- No array symbols in the start [ & end ].
- Schema should be separated by a folder in S3 bucket (Means each s3 bucket folder should contain unique schema of JSON files to avoid issues for Glue data catalog creation).
Sample JSON format:
{ “name”: “Albert”, “numPets”: 1, “birthDate”: “1970-01-01 07:20:00” }
{ “name”: “Albert 1”, “numPets”: 1, “birthDate”: “1970-01-01 07:20:00” }
{ “name”: “Albert 2”, “numPets”: 1, “birthDate”: “1970-01-01 07:20:00” }
{ “name”: “Albert 3”, “numPets”: 1, “birthDate”: “1970-01-01 07:20:00” }
{ “name”: “Albert 4”, “numPets”: 1, “birthDate”: “1970-01-01 07:20:00” }
To get rid of ‘OptionsRequestDenied’ error when uploading Files to S3 bucket using Safari browser, under Privacy settings of this browser make sure to disable “cross-site blocking” for uploading the files successfully.